The Importance of Infographics: Visualizing successful communications for your Brand.
Breaking through the clutter of mass communication is getting more and more challenging in this age of social media, with all of its YouTube videos, Facebook updates, and tweeting. People no longer want to read lengthy prose to be informed or educated—they want to be entertained, and given a “Cliff’s Notes” overview of the material being communicated. But how can you possibly differentiate your product or service in 140 characters or less, or through constant “likes” or “comments”? Is it possible to make sure that relevant information is getting through the clutter?
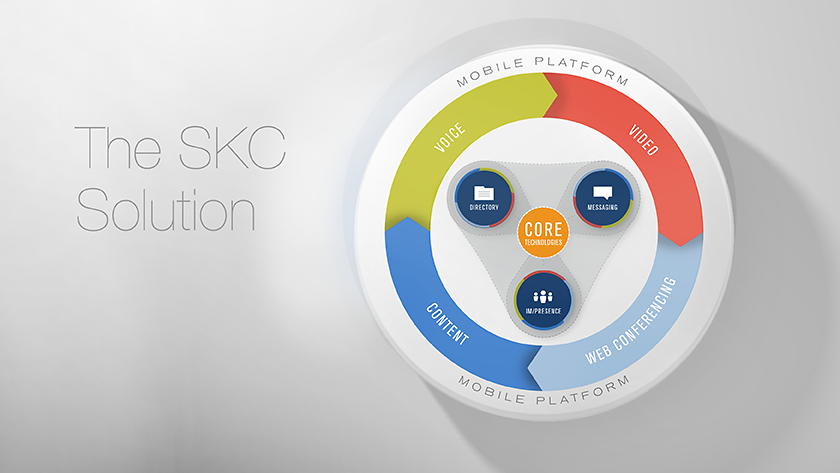
SKC Solutions graphic used in PowerPoint slides and as a print out.
Technology has allowed for the collection and storage of immense amounts of information about customers: profiles, preferences, and purchase histories that may be used to better target and market to them. While providing a spreadsheet with rows upon rows of data and numbers might make the case for your brand; that message will be lost because most people won’t take the time to read, let alone digest all of that information. It’s one thing to collect a lot of information, but if people don’t know what to do with it or can’t understand quickly what it means to them, what’s the point? A more compelling way to reach your audience is through the use of infographics.
Many might think of infographics (“information graphics”) as simply charts or graphs—something created in Microsoft Excel to show financial information. The truth of the matter is that infographics may contain a wealth of information and help simplify complex data into visuals that are quickly comprehended by the audience. Infographics help people understand and filter out the most important information—in other words, they can quickly make your brand’s communications relevant. Simply put, they tell a story.
Arguably the first commercial use of infographics, from 1869, diagrams the correlation between the number of troops, distance, and weather during Napoleon’s invasion of Russia.
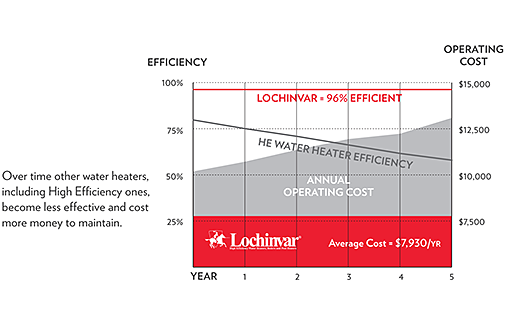
Indicia developed the infographic above for a promotional piece for Lexington Plumbing and Lochinvar to communicate the efficiency of water heaters over time, and associated operating costs.
Infographics and data visualization (new corporate buzzword, anyone?) don’t have to be static visuals, such as pie charts, graphs, diagrams, or color-coded maps. They can be animated into moving and interactive components for presentations, web sites, and onscreen display. Motion infographics allow you to communicate many different data points in short, compelling videos that people will actually watch and understand.
Newspapers and magazines have long used call-outs (bite-size pieces of content from an article, or a pulled quote from an interview) to engage readers. Much like well-written headlines that draw readers into a news story or article, infographics can do the same for your brand by allowing audiences to quickly, and visually, comprehend information that is valuable to them. If a picture is worth a thousand words, infographics can be worth hundreds, thousands, and even millions of data points and bits of information. To view samples of graphics Indicia has created for some of our clients, please scroll down.
By: Ryan Hembree, Principal | Brand and Creative Strategy
Infographics help communicate a lot of data about Garney Construction in a way that is meaningful for employee-owners and recruits.
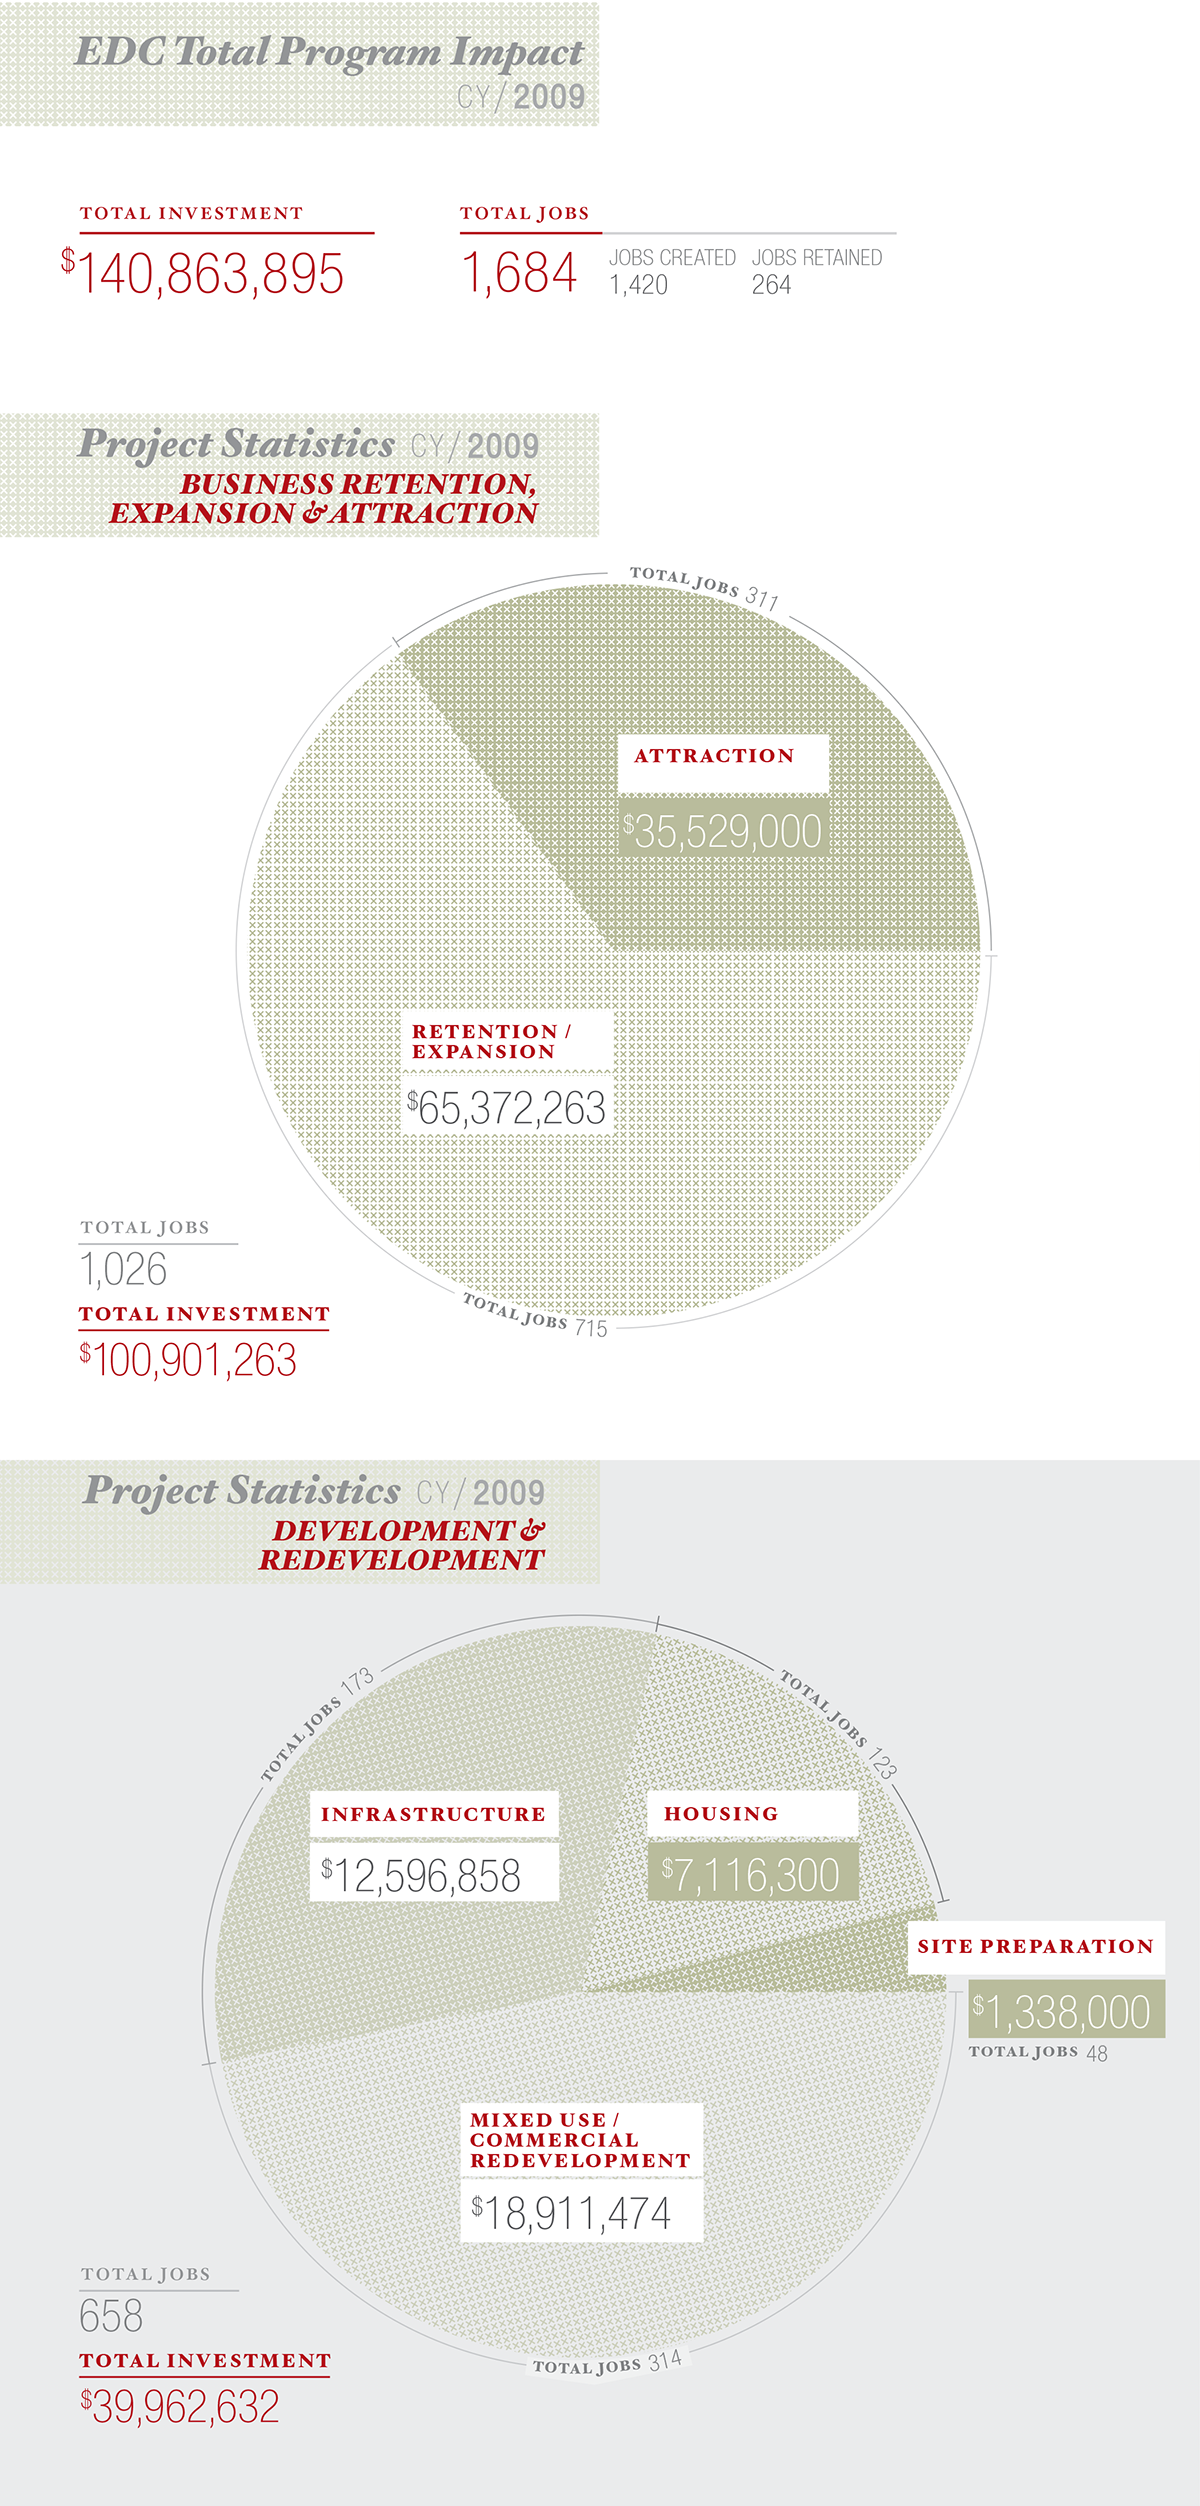
Financial Data infographics for the Economic Development Council of Kansas City, 2009 Annual Report.

 Infographics help communicate a lot of data about Garney Construction in a way that is meaningful for employee-owners and recruits.